Float Value Simulator
A utility to generate floating point values that look like real world data. The data is modeled after provided arguments and will have normal distribution.
Why not use Numpy?
Each generated value is based on the previous value, so the result set will look and measure like real world sensor data.
Libraries like numpy also offer normal distributed values, but these values are
unordered. E.g. we have a temperature sensor with an average value of 6.4° and a
standard deviation of 0.2. The order of values are completely different when
simulating those values with the float_simulator vs. numpy.
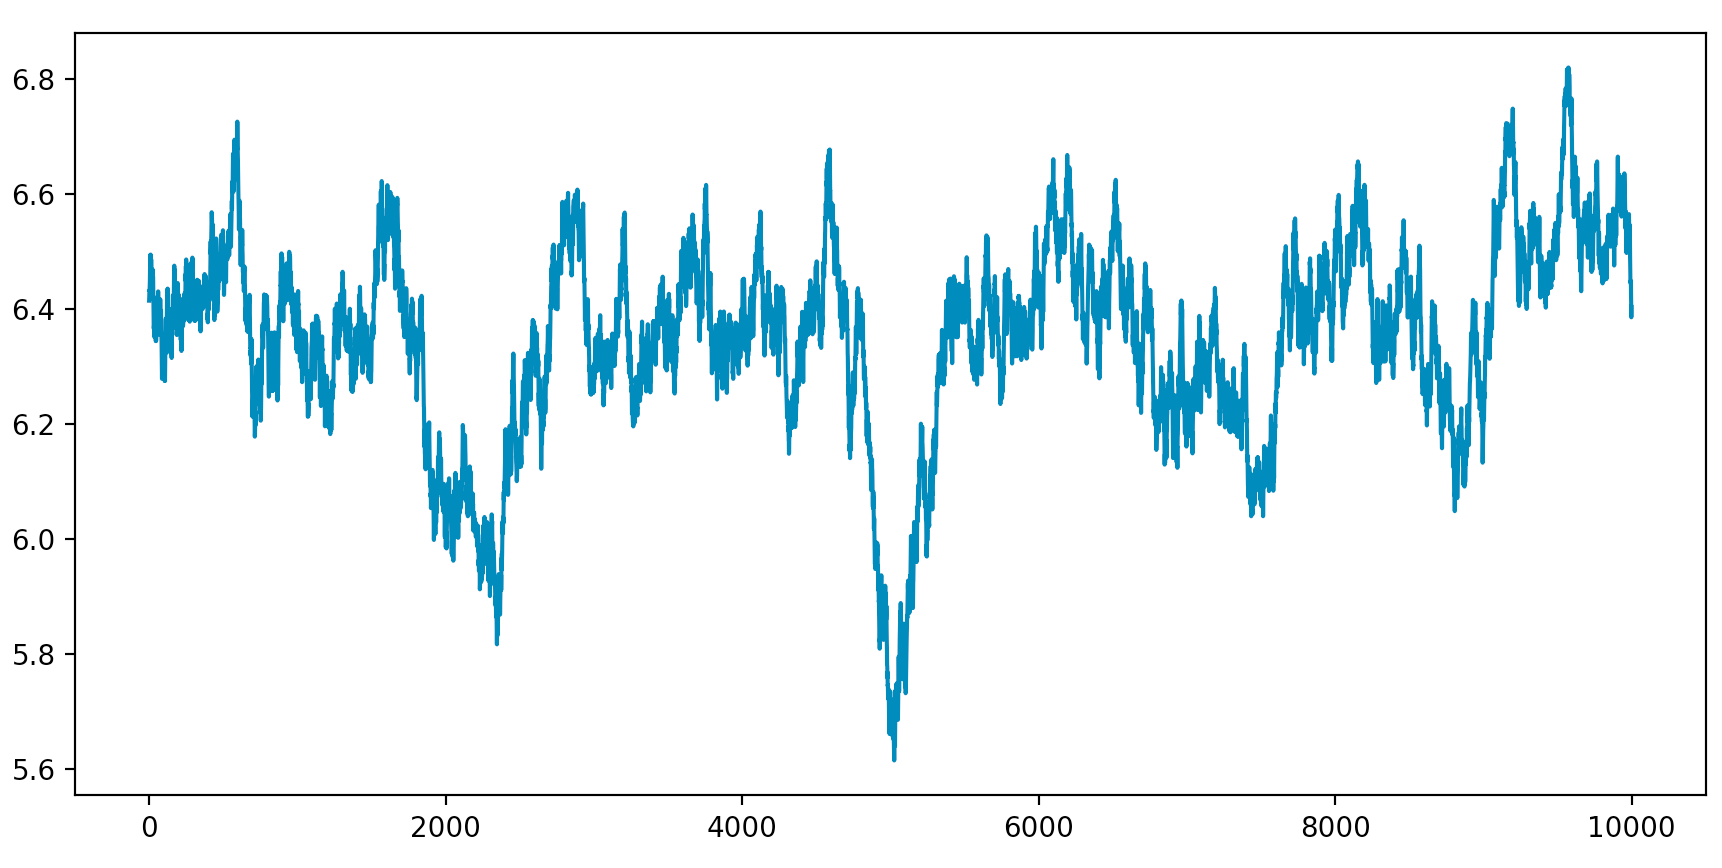
Order of values
Float Simulator
10.000 values, with mean=6.4, stdev=0.2:
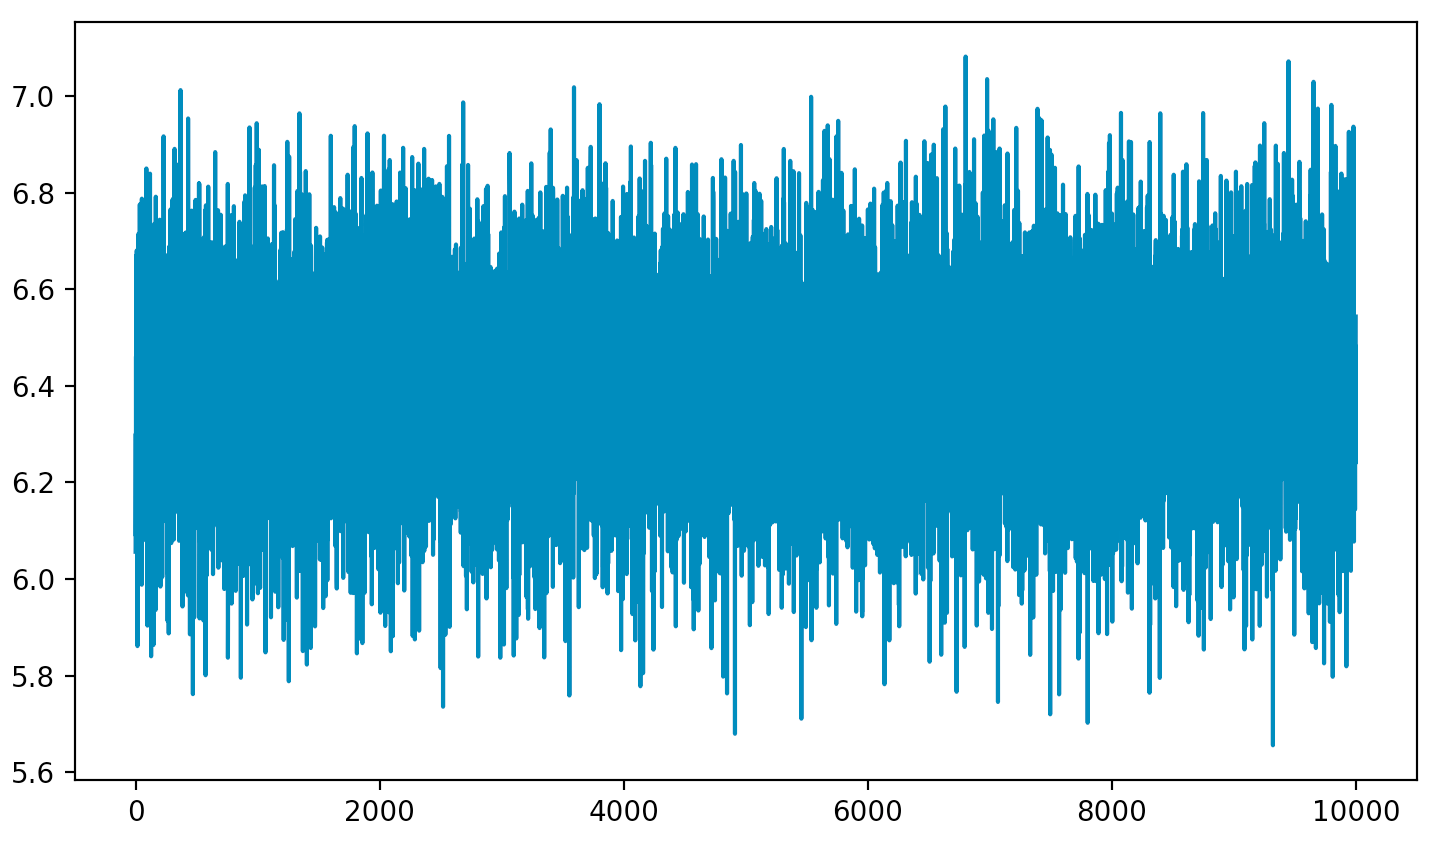
Numpy
10.000 values, with loc=6.4, scale=0.2:
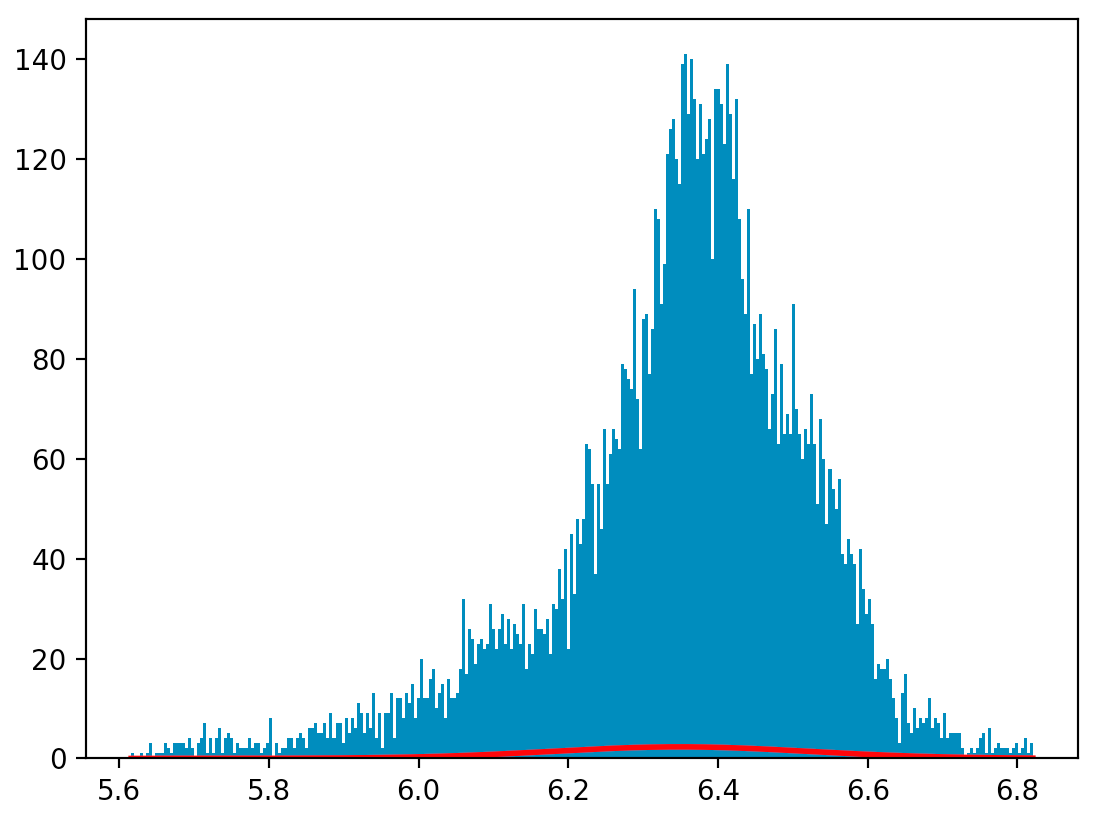
Distribution
Float Simulator
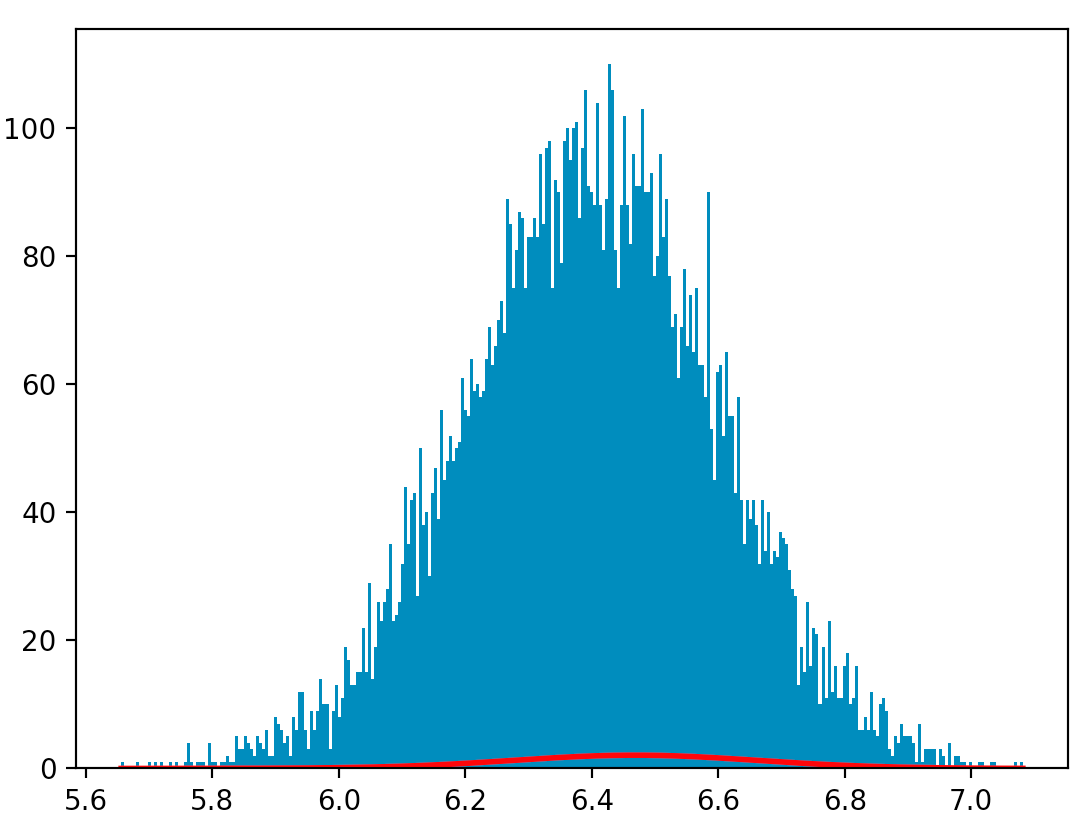
Numpy
Usage
Instantiate a FloatSimulator object and calculate a number of values for it:
from tsperf.util.float_simulator import FloatSimulator

mean = 5
min = 3
max = 7
stdev = 0.3
variance = 0.01

sensor = FloatSimulator(mean, min, max, stdev, variance)
sensor_values = []

for i in range(0, 10000):
    sensor_values.append(sensor.calculate_next_value())
sensor_values is now an array of 10.000 consecutive values generated by the FloatSimulator.
Errors
As real world data, especially sensor readings, contain errors the float_simulator also includes an option to
simulate errors. The two optional arguments error_rate and error_length set the error behaviour of the
float_simulator.
Currently errors take a random value below or above the minimum and maximum arguments. A more sophisticated behaviour is on the road map for the next release.
error_rate
The error_rate is the chance to encounter an error in percent with 1 meaning an error is encountered 100% of the
time and 0.01 meaning an error is encountered 1% of the time.
error_length
The error_length is the duration for how many values an error is sustained it’s value is also interpreted as percent
but each iteration reduced by 1. E.g. a value of 1.9 means the error is sustained for 1 more value and then has a 90%
chance to be maintained an additional value. If an error has been encountered the minimum chance of maintaining an error
value is 0.01 or 1%.